Grafana Cloud and Pulze.ai just integrated to enable fastest and easiest way to setup LLM observability for your product

In the fast-evolving domain of LLM applications, observability and performance have become critical. Monitoring the operational health and performance of LLM applications remains a challenge. We at Pulze aspire to advance LLM operations (LLMOps) with the power of a strong open-source ecosystem. Harnessing the power of our Dynamic LLM Automation Platform (DLAP), paired with the robust capabilities of Prometheus, Loki, and Grafana, offers a new realm of observability for your LLM applications. With our recent integration, you can tap into a plethora of metrics, understanding not just application performance but also optimizing costs, ensuring efficient operation, troubleshooting and crafting applications that stand out. You can now, for the first time, push your metrics and logs to Cortex, Thanos or Grafana Cloud.
Logan Smith
Director, Business Development - Global Ecosystem & ISV Partnerships at Grafana Labs
To further simplify your journey, we've crafted a dashboard for you. Dashboard ID: 19853 is a comprehensive space where you can visualize the heartbeats of your LLM operations.
Let's explore this furter.
Dashboards: A Window to LLM Applications
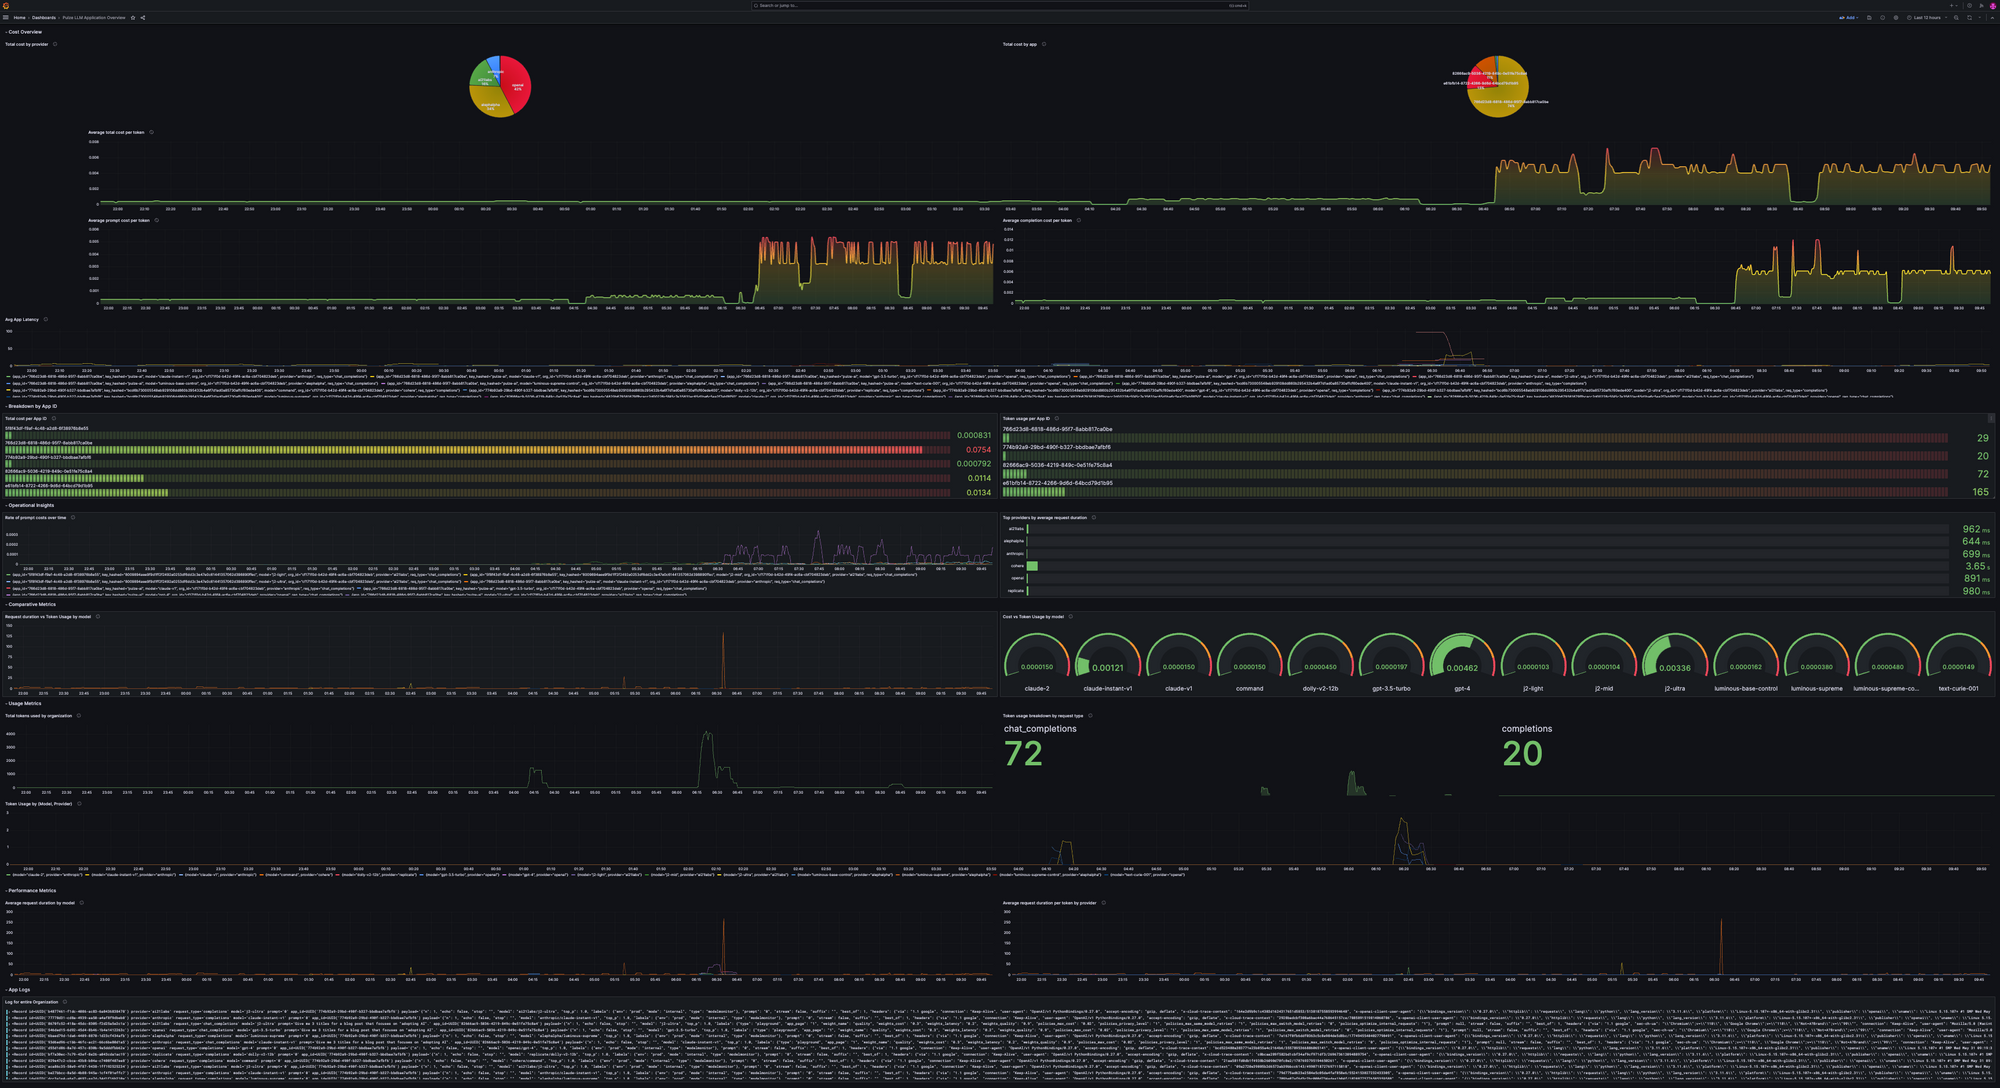
With this integration, the power to build intuitive dashboards is now in your hands. Gain granular insights into what's happening within your LLM applications:
- Track token consumption across various models and providers.
- Monitor application-specific metrics like latency or token throughput.
This new realm of observability opens doors to creating custom alerts leveraging Grafana and Prometheus ecosystems. For instance, setting alerts for unusual spikes in app latency is now at your fingertips.
Here's again the Dashboard ID: 19853 we mentioned before: it isn't just a collection of numbers—it's an insight engine that gives you a bird's-eye view and microscopic details of your LLM operations.
Cost Dynamics
Delve into cost analytics to grasp the efficiency of each token and comprehend the expenditure spread across different providers.
Performance Pulse
With model-centric insights, you can evaluate agility, pinpointing which models are sprinters and which ones are marathon runners. Dive deeper to unravel provider-specific efficiencies, understanding the time-cost of every token.
Token Tales
Tokens are the lifeblood of your operations. With our dashboard, you can identify top token-consuming organizations and decode the appetite of different request types.
Comparative Insights
Metrics aren't just about individual numbers—it's also about relationships. Understand the intricate dance between cost and token usage or measure the efficiency dance between request durations and tokens. Which models are cost-effective? Which ones provide bang for your buck? The answers are a click away.
Operational Deep Dives
Operational insights help gauge prompt spending patterns, ensuring you are always in the know. And if performance is your concern, our dashboard can introduce you to the top-performing providers, the ones setting the gold standard.
The App-Specific Lens
Every app has a story, and with app-centric metrics, you'll know if it's a success story or one that needs a rewrite. Track cost allocations and token footprints to keep your operations on point.
Metrics at Your Disposal
Here's a list of currently available metrics with Pulze.ai:
pulze_app_request_completion_costspulze_app_request_duration_secondspulze_app_request_duration_seconds_per_tokenpulze_app_request_prompt_costspulze_app_request_total_costspulze_app_request_usage_completion_tokenspulze_app_request_usage_prompt_tokenspulze_app_request_usage_total_tokens
Crafting Prometheus Queries: Examples Unveiled
Prometheus, being a robust monitoring solution, has its query language. Here's a glimpse into how you can craft your Prometheus queries for LLM applications:
sum(rate(pulze_app_request_usage_total_tokens[5m])) by (model, provider)- This query sums up the rate of token usage over a 5-minute window, segmented by model and provider.avg_over_time(pulze_app_request_duration_seconds[10m])- This allows you to discern the average latency of an app over the last ten minutes.
Decoding the RAG Pipeline with Pulze Metrics
The RAG (Retrieval Augmented Generation) pipeline is foundational to many LLM operations. When you’re working with systems like LlamaIndex or LangChain, which often operate discreetly, these metrics emerge as your indispensable windows into the inner workings of these complex systems.
For instance, pulze_app_request_usage_total_tokens can show you a detailed breakdown of request costs. This aids in understanding the pricing structure of the different stages of the RAG pipeline. Observing the pulze_app_request_duration_seconds can pinpoint which segment of your pipeline might be causing bottlenecks or latency issues, allowing for quicker troubleshooting and optimization.
Troubleshooting LLM Applications
LLM Applications, given their dynamic, probabilistic and interactive nature, can sometimes be a challenge to troubleshoot. This complexity arises primarily from the multifaceted ways in which they process language and interact with users, which can result in elusive and unpredictable issues that demand a nuanced approach to debugging and problem-solving. Here's how Pulze's metrics can be of assistance:
- Performance Metrics:
pulze_app_request_duration_secondscan help monitor the response time of your chatbot, offering insights into any delays in interactions and helping you improve user experience. - Cost Analysis: By looking at
pulze_app_request_prompt_costsandpulze_app_request_completion_costs, you get a clear picture of the cost distribution between initiating a prompt and its completion. This can guide you in resource allocation and budgeting for LLM operations.
Loki: Streaming, Processing, and Beyond
By harnessing the potent capabilities of Loki within our solution, you gain the ability to seamlessly live stream logs from any specific LLM application directly onto your Grafana dashboards. Loki, a robust log aggregation and query system, excels in efficiently handling large volumes of log data and providing real-time insights into your system's performance and behavior. What's even more captivating is Loki's advanced processing capability, which empowers you to craft custom metrics derived from LLM logs. This ensures that you extract every ounce of valuable information encapsulated within the logs, allowing you to make informed decisions and optimize your LLM applications to their full potential.
For instance, a Loki query like {app_id="my-llm-app-id"} |= "error" will help you fetch logs containing the keyword 'error' for the specific application.
High-level Observability: All in One Place
In line with the LGTM stack philosophy, Pulze allows you to centralize logs and metrics from all providers. No longer do you have to toggle between different tools or dashboards. A unified view ensures you understand the complete story of your LLM applications, their performance metrics, and logs, all in one place.
Enabling the Integration
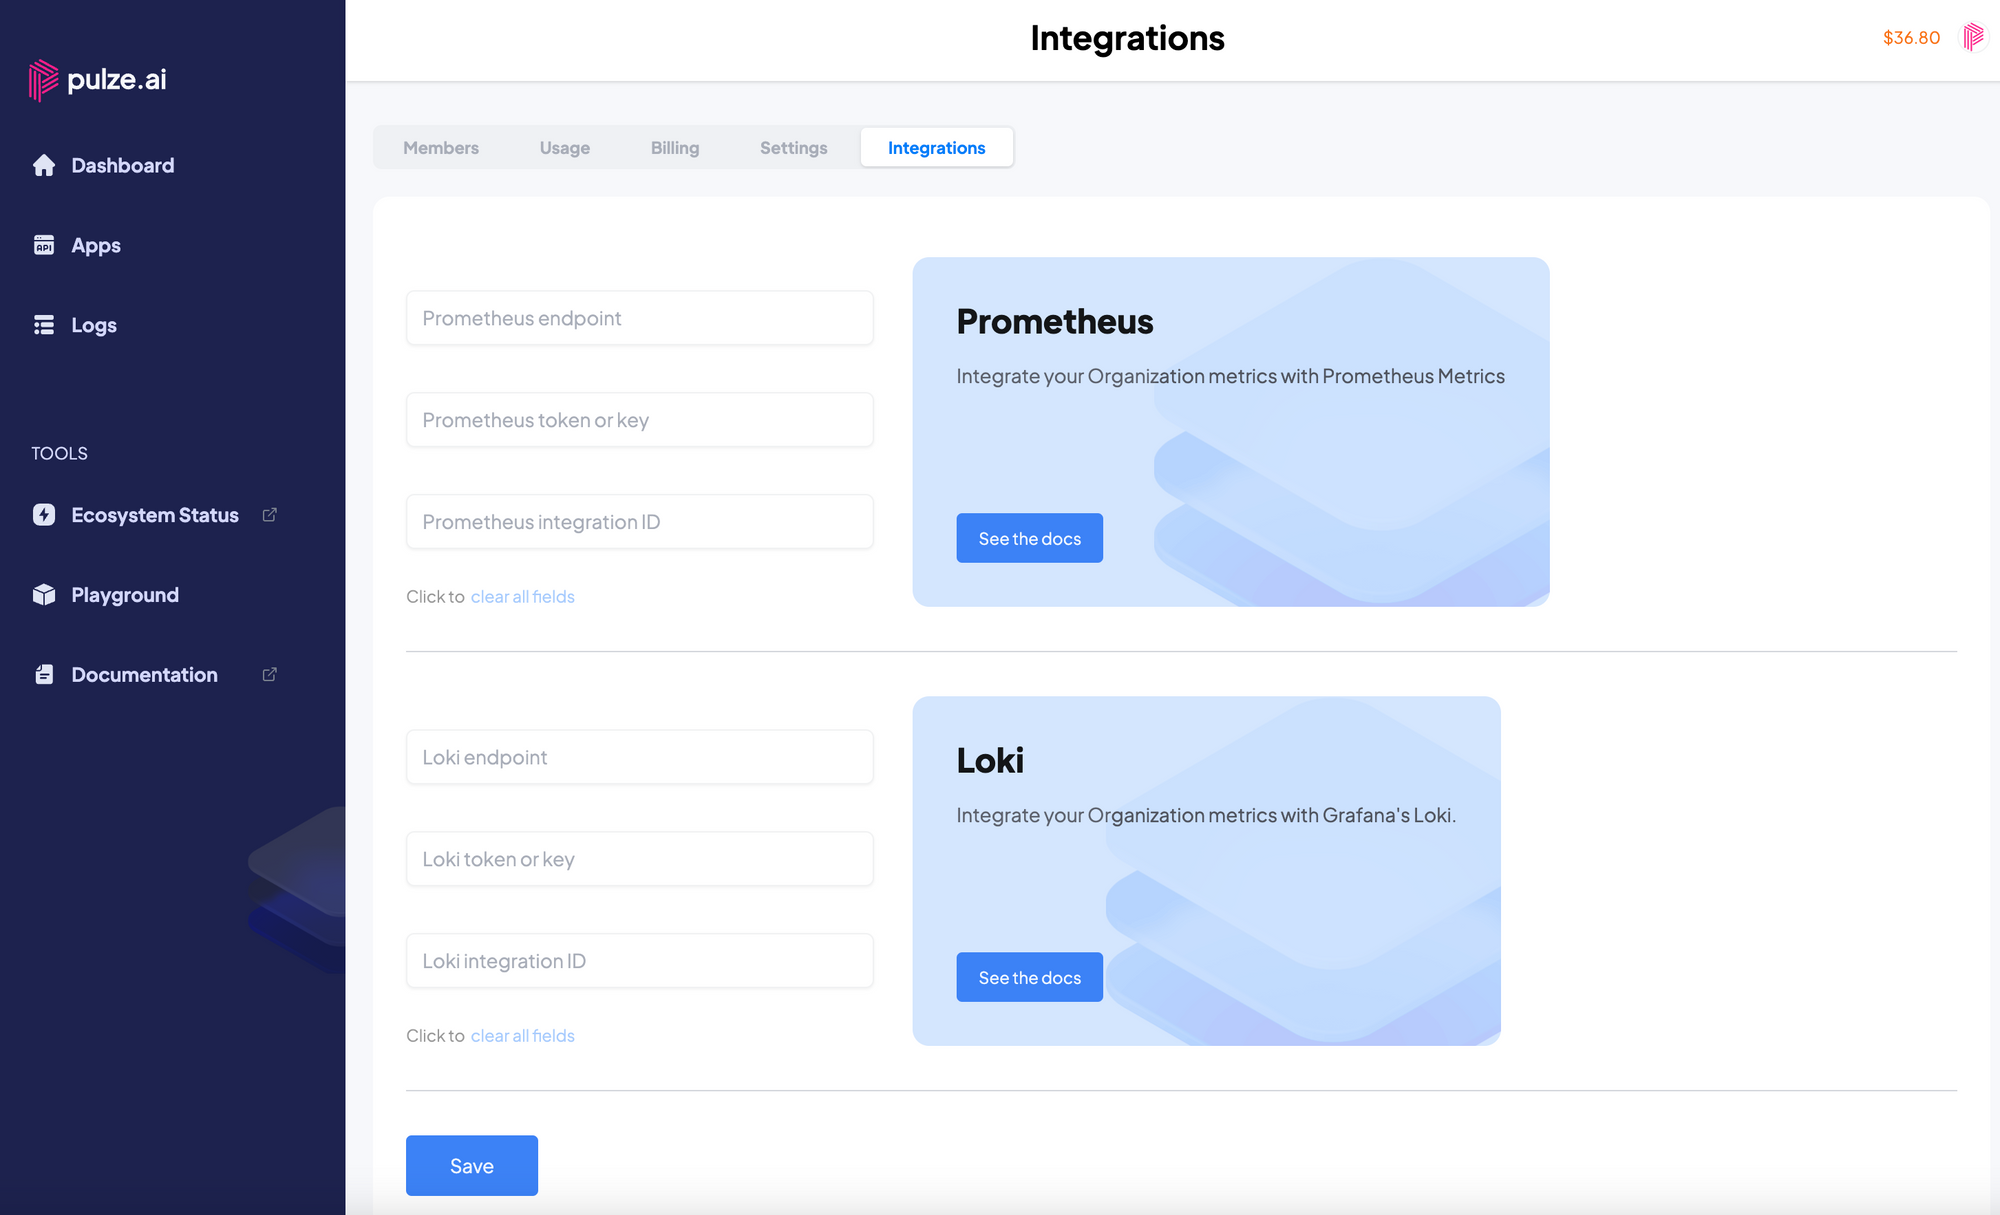
To take advantage of these metrics and logs, you'll first need to enable the integration within Pulze.ai. Here's a step-by-step guide:
- Accessing Integration Settings:
- Navigate to Organization Management on the Pulze.ai platform.
- Click on the Integrations tab.
- Setting Up Prometheus:
- Under the Prometheus section, you'll find an option to add a
remote_writeendpoint. This is where you can integrate with not just Prometheus, but also compatible systems like Cortex and Thanos. Provide the required endpoint details.
- Under the Prometheus section, you'll find an option to add a
- Setting Up Loki:
- Scroll to the Loki section.
- Input your Loki endpoint and other required details.
- Finalizing the Integration:
- You can choose to integrate with either Prometheus, Loki, or both depending on your observability needs.
- Once the endpoints are provided, save the settings to activate the integration.
A Glimpse into the Horizon: Upcoming Features and Explorations
As we navigate the intricate world of LLM applications and observability, our commitment remains unwavering—to consistently enhance and simplify your experience. On this journey, we're eager to share that our next focus is to make integrations even smoother.
Coming Up Next: In our subsequent blog post, we'll be diving deep into the nuances of integrating standalone Grafana instances. Ever wondered how you can effortlessly connect your Grafana setup to the /v1/metrics/prom endpoint? The magic lies in just adding your App key.
This is just a glimpse of the ease and flexibility we aim to bring to the table. It's not just about providing tools; it's about ensuring these tools harmonize seamlessly with your workflows, maximizing efficiency and reducing complexity.
Stay tuned as we continue our exploration, bringing more insights, tips, and tricks to supercharge your LLM operations. Together, we'll script new narratives of efficiency and innovation.
By tapping into the power of Pulze's metrics combined with the visualization capabilities of Grafana, troubleshooting and optimizing LLM applications becomes a streamlined process. Dive into this integration, and empower yourself to manage and expand your LLM operations with precision. Read more on our documentation page!